
To determine the optimal number of clusters in K-Means using Elbow and Silhouette methods
Introduction
K-means Clustering is an unsupervised learning algorithm that is used to solve clustering problems in machine learning or data science. It groups the unlabeled dataset into different clusters. Here’s how it works:
- Initialization: Select the number K to decide the number of clusters.
- Assignment: Assign each data point to their closest centroid, which will form the predefined K clusters.
- Update: Calculate the variance and place a new centroid of each cluster.
- Iteration: Repeat the assignment and update steps until no reassignment occurs.
The main aim of this algorithm is to minimize the sum of distances between the data point and their corresponding clusters. The value of K should be predetermined in this algorithm. The algorithm takes the unlabeled dataset as input, divides the dataset into K-number of clusters, and repeats the process until it does not find the best clusters. It’s a centroid-based algorithm, where each cluster is associated with a centroid.
Elbow method
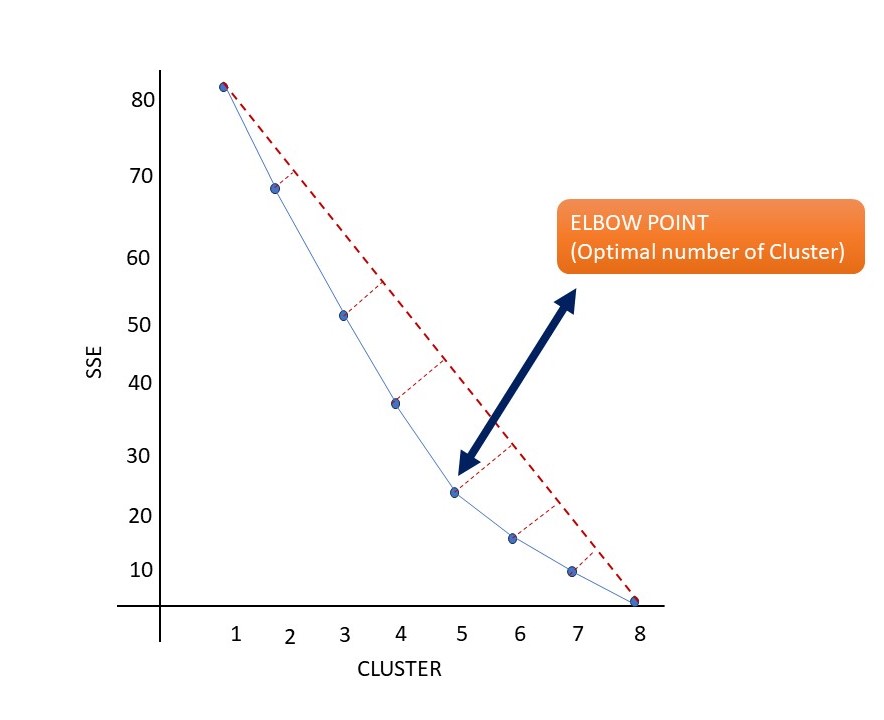
The elbow method is a technique used to determine the optimal number of clusters in a dataset for the k-means clustering algorithm. The method involves plotting the explained variation as a function of the number of clusters and selecting the "elbow" of the curve as the number of clusters to use. This is because, as the number of clusters increases, the variation within each cluster decreases, and at some point, the decrease in variation becomes less pronounced. The point at which this occurs is considered to be the optimal number of clusters for the dataset.
Properties and features of the elbow method are:
- It is a heuristic used in determining the number of clusters in a data set.
- It can be used to choose the number of parameters in other data-driven models, such as the number of principal components to describe a data set.
- It is considered both subjective and unreliable, as in many practical applications, the choice of an "elbow" is highly ambiguous as the plot does not contain a sharp elbow.
- There are various measures of "explained variation" used in the elbow method. Most commonly, variation is quantified by variance, and the ratio used is the ratio of between-group variance to the total variance.
The steps to find the elbow point using the elbow method:
- Run K-means for a range of K's.
- Calculate the Sum of Squares of the distances from the cluster mean.
Where:
- xj is an object in the cluster Ci.
- ui is the centroid of the cluster Ci.
- Plot a curve of the SSE over K's.
- Visually pick the K at the elbow.
Silhouette Method
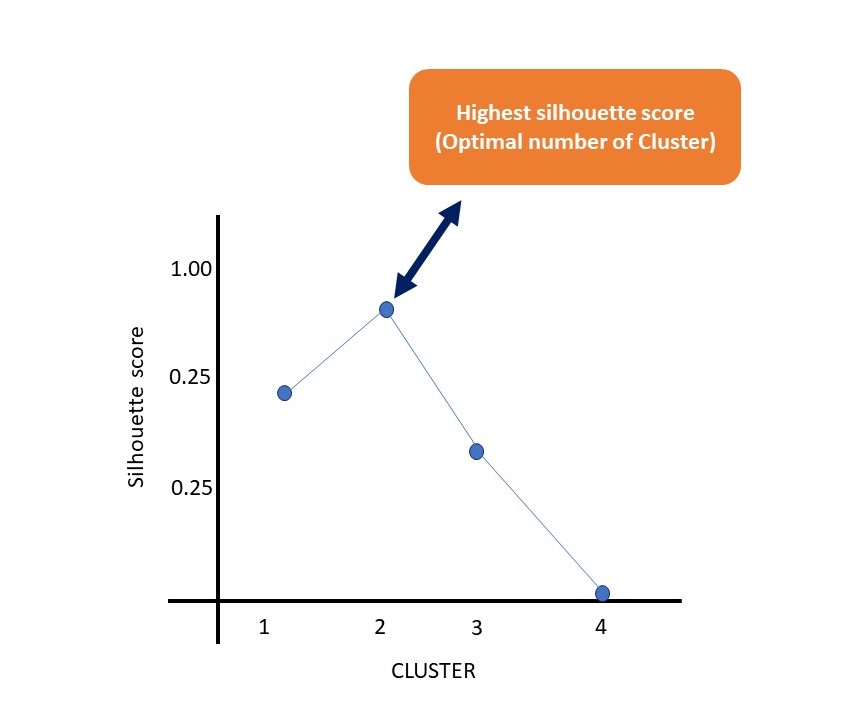
The silhouette method is a technique used to interpret and validate the consistency within clusters of data. It provides a succinct graphical representation of how well each object has been classified. The silhouette value is a measure of how similar an object is to its own cluster (cohesion) compared to other clusters (separation). The silhouette ranges from −1 to +1, where a high value indicates that the object is well matched to its own cluster and poorly matched to neighboring clusters. If most objects have a high value, then the clustering configuration is appropriate. If many points have a low or negative value, then the clustering configuration may have too many or too few clusters.
Properties and features of the silhouette method:
- It is used for finding an optimal number of clusters.
- It is better than the elbow method to find optimal clusters.
- The silhouette can be calculated with any distance metric, such as the euclidean distance or the Manhattan distance.
The silhouette coefficient ranges from -1 to 1, where a high value indicates that the object is well matched to its own cluster and poorly matched to neighboring clusters.
The steps to calculate the silhouette coefficient for a particular data point:
-
Cohesion : Coupling (also called cohesion) measures how closely related or similar the data points are within the same cluster. High coupling indicates that data points inside a cluster are tightly grouped and well connected.
Calculate the average distance between the data point and all other data points in the same cluster. This is known as "a(i)".
-
Separation : Separation measures how far apart or distinct different clusters are from each other. High separation indicates that clusters are well separated and clearly distinguishable.
Calculate the average distance between the data point and all other data points in the nearest cluster. This is known as "b(i)".
-
Calculate the silhouette coefficient `s(i)` for the data point using the formula "s(i)".

Difference between Elbow method and Silhouette method
The Elbow Method and the Silhouette Method are two different ways of finding the optimal number of clusters (K) in a dataset.
Elbow Method: This method uses the euclidean distance between the data points and the cluster centroids to measure the quality of clustering. It is simpler and faster, and it’s called the “elbow” method because when you plot the sum of squared distances (inertia) for different values of K, the plot resembles an arm, and the “elbow” point (where the rate of decrease sharply shifts) is considered as a good indication of the optimal K.
Silhouette Method: This method uses the average distance between the data points within the same cluster and the nearest cluster to measure the cohesion and separation of clusters. It is more comprehensive and accurate. The silhouette score ranges from -1 to +1, where a high value indicates that the object is well matched to its own cluster and poorly matched to neighboring clusters.
Conclusion
The elbow method and the silhouette method are two techniques used to determine the optimal number of clusters in a dataset for the k-means clustering algorithm. Both methods are based on measuring the similarity or dissimilarity between the data points and the cluster centroids. The main difference between the two methods is that the elbow method uses the sum of squared distances (SSE) as the variation measure, while the silhouette method uses the silhouette coefficient as the consistency measure. The elbow method plots the SSE against the number of clusters and looks for a point where the curve bends or elbows. The silhouette method plots the silhouette coefficient against the number of clusters and looks for a point where the curve reaches its maximum. Both methods have advantages and disadvantages, such as simplicity, reliability, and sensitivity to different factors. Therefore, it is advisable to use both methods together and compare their results to find the best number of clusters for a given dataset.